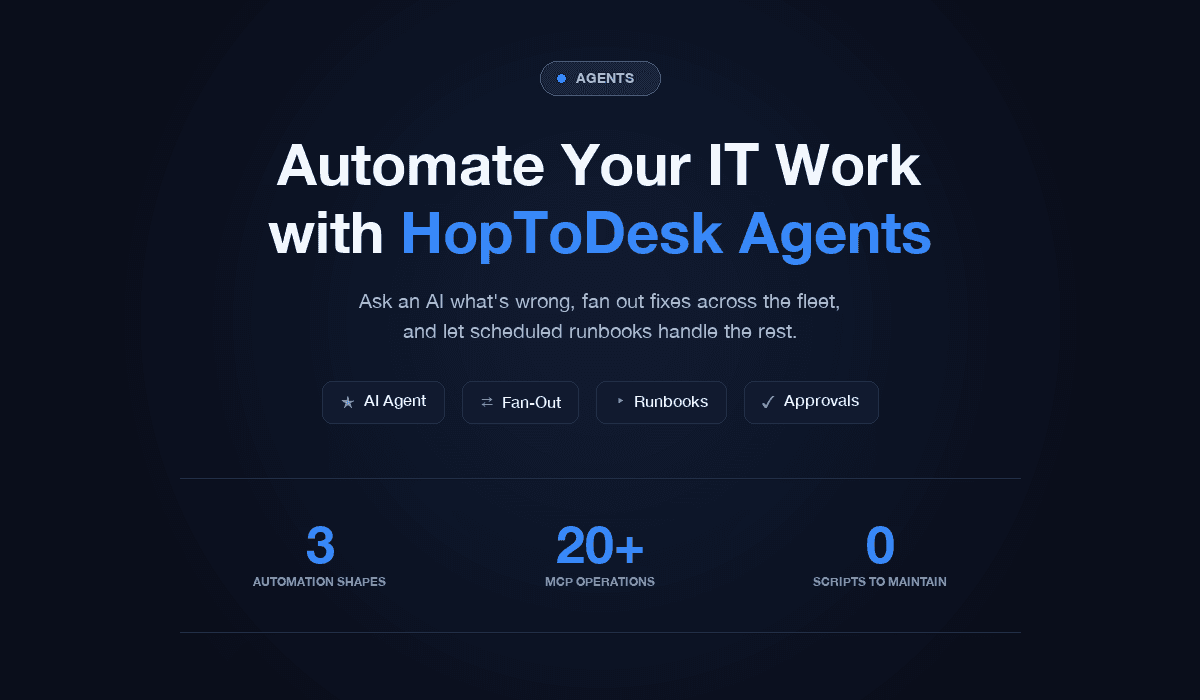
Automate your IT work with HopToDesk Agents
The Agents section of HopToDesk Dashboard Pro turns repetitive IT work into something you declare once and forget. Ask an AI what's wrong, f
Most IT work isn't hard. It's repetitive. The same disk-space check on fifty laptops. The same service restart at two offices. The same diagnostic walkthrough every time a user says "my computer is slow." Humans are wasted on it, and yet we keep doing it manually because stitching together a proper automation used to cost more than the work itself.
That's the bet we're making with the Agents section of HopToDesk Dashboard Pro: if the dashboard already knows your devices, and the HopToDesk client on each device already has a programmable surface, then automation should be a checkbox — not a project.
This release turns that bet into a real product. Three ways to hand the keyboard to a machine instead of typing everything yourself:

Ask an AI what's wrong on a device, in plain English. It runs the diagnostics for you and tells you what it found.
Fan out a command to every device matching a tag, with one click and aggregated results.
Schedule a runbook so the same hygiene check or cleanup runs on its own, forever.
All three share the same foundation: a safe set of predefined operations that the HopToDesk client knows how to execute on Windows, macOS, and Linux. No SSH keys. No scripts to maintain. No agents to install (the HopToDesk client is the agent). Everything is policy-driven, fully audited, and gated behind per-account and per-device opt-ins. Devices need a recent HopToDesk client build with the MCP server enabled — older clients can still be viewed from the dashboard but aren't drivable from Agents yet.
Here's a tour.
Shape 1 — Ask an AI
The fastest way to do IT work is to describe the goal and let a model figure out the steps. The AI Agent tab is a Claude-powered chat that can see your devices (read-only by default) and run any of the built-in operations on them when you ask.

Under the hood, the AI Agent has access to the same set of MCP tools that power the rest of Agents: get_system_info, list_processes, disk_usage, ping_test, installed_software, restart_hoptodesk, and about a dozen more. When it picks tools to call, you see them streaming in the chat as it works. When it's done, you get a plain-English summary with actionable buttons: Restart Chrome, Show me the process list, Check other laptops.
It's priced per request (typically $0.05–$0.50, depending on the model tier and how many devices it inspects), billed from a wallet you top up yourself. The cost shows up after every response so there's no surprise bill.
When the AI makes sense
Fuzzy problems. A user says their laptop is slow. You'd normally spend ten minutes SSHing in and running
top,df,ps. Ask the AI instead.First-touch triage. Before escalating a ticket, let the AI do the obvious checks and summarize.
Unknown fleets. You just inherited a customer's environment. Ask "give me a health snapshot across their machines" and it'll fan out diagnostics and summarize by risk.
Bridging skill gaps. A junior tech on your team can ask plain-English questions and get guided output, without needing to know the exact flags or commands.
When the AI doesn't make sense
You already know exactly what to run on exactly which devices. Go straight to fan-out — it's faster and free.
You need the same thing to happen every night at 3 AM. Go to runbooks.
You're running a regulated, audited operation where a deterministic path matters more than flexibility.
The AI is one of the three shapes, not the shape. The other two are for when you already know what you want to do.
Shape 2 — Fleet commands
Sometimes you don't need a conversation. You need "restart the HopToDesk service on every machine in the NYC office, now, in parallel." That's what fan-out is for.
The building blocks:
Tags. Flat labels you put on devices. Many per device. Use them to group by anything: role (web, db), location (office-nyc), OS (linux), customer (client:acme). A single machine can carry all of those at once.

Fan-Out. Pick an operation, pick a target (a set of tags, an explicit device list, or all), see exactly how many devices will be hit, then dispatch. Each device gets its own command; the dashboard aggregates progress into one job.

Two things worth calling out in that form:
Target preview — before you click Dispatch, the form resolves your tag list and shows "Will target 3 device(s)". If it feels too small or too big, you catch it before you act.
Typed acknowledgement — if you're about to run a destructive operation on more than 10 devices (or
all), the dashboard asks you to type the operation name to confirm. Friction exactly where friction belongs.
Every job has a history row, a per-device breakdown with output previews, and a CSV export button. That last one matters more than it sounds — "prove you patched everything" is a routine ask in compliance audits, and a CSV is the easiest answer.

When fleet commands make sense
Bulk actions you already understand. You know what needs to happen and where. Fan-out is the shortest path from intent to execution.
Incident response. Something broke in one location. Tag-targeted fan-out beats clicking through devices one at a time.
Ad-hoc inventories. "What's installed across all our customer machines?" One fan-out, one CSV.
Shape 3 — Hands-off schedules
The third shape is automation you set and forget: the nightly disk check, the weekly temp cleanup, the hourly health snapshot. That's Runbooks.
A runbook is just a saved fan-out with a schedule. Pick an operation, pick a target, pick a cadence (every N minutes, daily at a UTC hour, weekly, whatever), and enable it. The scheduler ticks every 5 minutes server-side and fires any runbook whose next-run time has passed.

Runbooks are pre-approved — the act of saving an enabled runbook is the approval. Use them for operations you've already vetted. If you want to pause one, toggle it off; the row stays. If you want to test one before trusting the schedule, hit Run Now and it fires immediately, appearing in your fan-out history with source scheduler:<id>.
When schedules make sense
Recurring hygiene. Temp cleanup, disk checks, service health. The work that's boring enough nobody remembers to do it.
Morning reports. A daily fan-out at 7 AM gives you a snapshot you can scan with coffee.
Compliance cadences. "We inventory software monthly" is one runbook away from being true.
The safety net
Three shapes of automation, one common guardrail stack:
Auto-approve rules
You don't want a junior tech rebooting the database box, but you also don't want to click Approve on every disk-usage check. Auto-approve rules are the policy layer between those extremes. Each rule matches on role + operation + tag, and takes an action: approve or deny. They're priority-ordered — lower number fires first — so a deny at priority 10 wins over an approve at priority 100 every time.

A baseline most teams end up with:
Priority 10 — DENY
reboot_deviceon tagprod(any role)Priority 20 — DENY
kill_processon tagservers(rolemember)Priority 100 — APPROVE
diagnostics:*(roleowner)Priority 110 — APPROVE
diagnostics:*(roleadmin)Priority 120 — APPROVE
diagnostics:*on tagworkstations(rolemember)
Owners and admins get frictionless diagnostics everywhere. Tier-1 help desk gets diagnostics on user laptops but not on servers. Production is hard-blocked from accidental reboots.
Write it once, it applies forever.
Approval queue
Anything that's not auto-approved lands here. An admin clicks Approve or Reject. A red pulsing badge on the sidebar Agents button means work is waiting — hard to miss.

Other guardrails
Global kill-switch — a per-account on/off switch that blocks every dispatch when off. Hit the Disable button on the AI Agent tab and every Agent operation halts immediately. A badge at the top of every Agents tab shows the current state.
Per-device allowlist — every command is checked against per-device permissions; devices can be individually excluded from fan-outs and runbooks.
Predefined operations only — the dashboard never ships shell commands. It sends operation names (
disk_usage,reboot_device); the client knows how to run each safely per-OS.Audit trail — every command logged with requester, approver, timestamp, device, exit code, and output (auto-scrubbed for credentials, tokens, and emails).
Rate limits — 30 commands/hour/account by default.
Watchdog — anything stuck
runningfor 5 minutes gets flipped totimeout.
The bias is toward visible friction for risky actions, zero friction for routine ones.
Popular scenarios
Six things teams are doing with this today:
"Why is this one laptop slow?"
Open AI Agent, pick the device, ask. Claude runs get_system_info, list_processes, disk_usage and summarizes. Total time: ~45 seconds. Total cost: ~$0.10.
"Restart the HopToDesk service at one office"
Tag the office devices office-nyc. Fan-out restart_hoptodesk at tag office-nyc. With an admin-level auto-approve rule, 40 devices restart in parallel in under a minute.
"Morning disk-space report across the fleet"
Daily runbook: disk_usage, target all, 07:00 UTC. Read the per-device results with coffee. No scripts, no cron on a jump box.
"Tiered help-desk permissions"
Two rules: tier-1 (member) auto-approves diagnostics:* on workstations only; tier-2 (admin) auto-approves diagnostics everywhere. Anything destructive falls through to the approval queue regardless — an owner handles those.
"Quarterly compliance: installed-software audit"
Ad-hoc fan-out of installed_software at target all. Export the job's per-device output as CSV. Done.
"Weekly DNS cache flush on flaky machines"
Tag the problem children dns-flaky. Weekly runbook: flush_dns on that tag, Mondays 04:00 UTC. One line of policy, no per-box cron.
Build on top: MCP + API keys
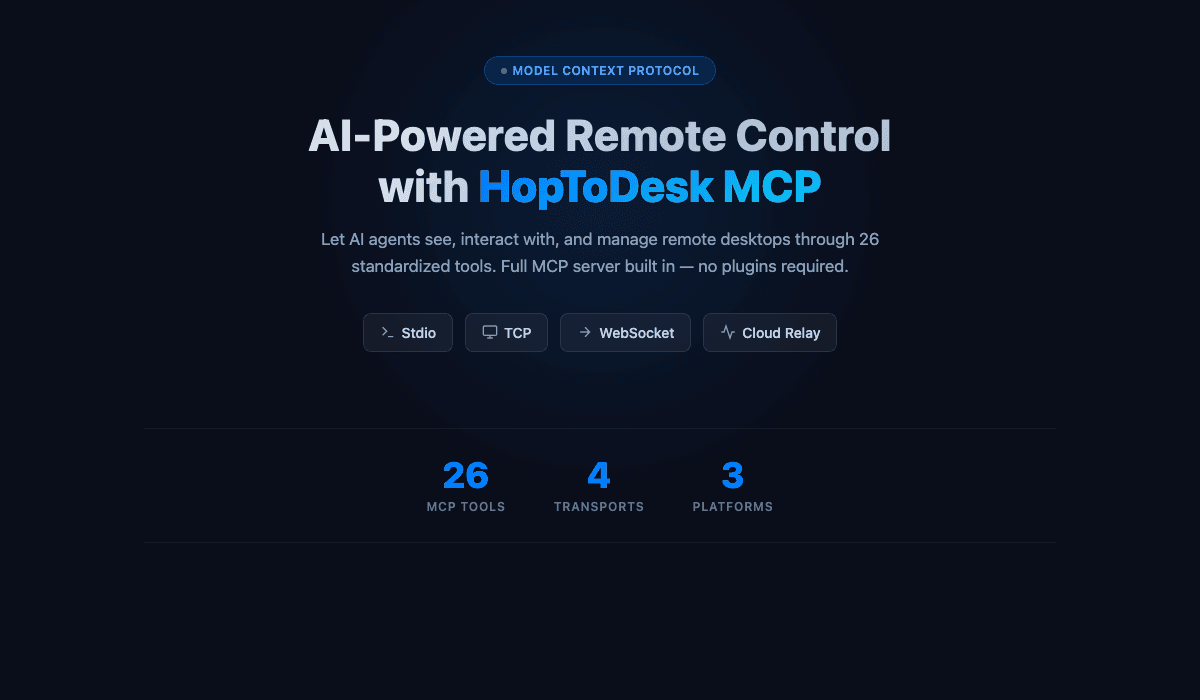
Everything the dashboard can do, your own code can do. The same Model Context Protocol that Claude uses to talk to your devices is exposed to any authenticated client with the mcp scope on an API key. A few examples:
Wire your Slack bot to the dashboard so
/htd restart chrome on miguel's laptopjust works.Have your ticketing system auto-post a diagnostic snapshot to a new ticket.
Build a custom escalation flow that only reaches a human after the AI has exhausted its moves.
Plug HopToDesk into your existing orchestrator — the dashboard is the control plane, everything else is a caller.
The MCP server runs inside the HopToDesk client on each device, not as a separate process. That's a meaningful difference: it gets the same visibility the remote-desktop session has (screen, windows, input), plus the safe diagnostic/maintenance operations, in one channel.
Setup lives in the Agents → Getting Started tab, under Advanced: Developer MCP Setup, including a copy-paste config for Claude Code and other MCP clients.
How to get started
Three minutes from "never used this" to "running an automated health check":
Open Agents. From the sidebar, click Agents. The Getting Started tab has a short tour.
Enable Agents. Go to the AI Agent tab, accept the terms, and click Enable Agents. That single click enables AI chat, fan-out commands, and runbooks across every device on your account.
Tag your devices. Agents → Tags. Add at least one tag per device so you can target groups later.
Try a fan-out. Agents → Fan-Out → pick
get_system_info→ target your tag → Preview targets → Dispatch. Watch the live progress.Write one auto-approve rule. Agents → Rules → New rule. Owner auto-approves
diagnostics:*on any tag. Now every diagnostic bypasses the queue.Save one runbook. Agents → Runbooks → New runbook.
disk_usageon yourserverstag, daily at 03:00 UTC. Sleep well.
After that, scale at your own pace. Add more tags. Add more rules as your policy matures. Let the AI handle ambiguous triage, fan-out handle bulk work, and runbooks handle the boring stuff on autopilot.
What's next
The release today covers the three automation shapes end-to-end. A few things we're actively working on:
Custom operations — define your own safe operations in the dashboard (e.g. "run
apt upgrade -yon Linux hosts"), with typed parameter schemas and per-OS implementations.Output parsing — extract structured values from operation results so you can alert on "disk >80% full" automatically, without building your own parser.
Multi-step runbooks — chain operations with conditional logic ("only reboot if the service is actually stuck").
AI as the driver for fleet operations — the AI Agent already has access to the fleet primitives; we're polishing the conversation so you can say "find every prod server with >80% disk and clear its temp files, no reboots" and have it fan out safely.
Try it
Agents is live on every HopToDesk Dashboard Pro account today. Nothing to install on your side, no extra subscription, no feature flag.
Log in at dashboard.hoptodesk.com → click Agents in the sidebar. The Getting Started tab walks through the rest.
Questions, bugs, feature requests: open a ticket from the dashboard, or hit us at hoptodesk.com.
Happy automating.